
Home › Solutions › Competitive Benchmarking & Positioning Research
⸺ Competitive Benchmarking & Positioning Research
You Cannot Set the Right Targets
Without Knowing Where You Stand.
Competitive Benchmarking & Positiononing Research for Indian Manufacturers
Good numbers mean nothing without context. Our Competitive Benchmarking & Positioning Research uses structured industry benchmarking surveys to show exactly where you stand against peers — across customers, operations, safety, and people — so leadership can set the right targets.
18+
YEARS CONDUCTING CSS RESEARCH
35+
INDUSTRIES RESEARCHED
90+
CLIENTS RETURN FOR ANNUAL BENCHMARKS
Pan-India
MULTISITE RESEARCH CAPABILITY
⸺ THE CHALLENGE
Good Numbers Mean
Nothing Without
Context.
A customer satisfaction score of 7.2 out of 10 — is that good? It depends entirely on what your competitors are scoring. An employee engagement score of 68% — is that a problem? Only benchmarking against your industry tells you whether you are a talent magnet or a talent risk.
Internal performance data without external context leads to false confidence, misaligned targets, and strategic blind spots. BPMBC's Competitive Benchmarking & Positioning Research give your leadership team the external reference points to set credible targets, make informed investment decisions, and identify where competitive advantage genuinely exists.
⚠️ Are your customer satisfaction scores above or below your industry peers?
⚠️ Are your targets ambitious enough — or are you celebrating average performance?
⚠️ Do you know which competitor processes, practices, or capabilities are outperforming yours?
⚠️ Where in your value chain do you have genuine competitive advantage — and where are you exposed?
✓ BPMBC provides the external context that turns internal data into strategic insight.

Four Types of Benchmarking —
We Deliver All of Them
⸺ benchmarking approach
The right type depends on your strategic question. BPMBC designs each study around your specific objective.
1
🏆
Competitive Benchmarking
A direct comparison of your performance against named or anonymised industry competitors — across customer satisfaction, service quality, delivery, pricing perception, and other dimensions relevant to your competitive position.
→ Best for: Customer satisfaction, NPS, service quality, brand perception
2
🏢
Internal Benchmarking
A structured comparison across your own sites, divisions, business units, or geographies — identifying best practices within your organisation and understanding the gap between top and bottom performers.
→ Best for: Multi-site operations, safety culture, employee satisfaction, process efficiency
3
⚙️
Functional Benchmarking
A comparison of specific functions or processes — procurement, logistics, customer service, HR — against industry best practice, regardless of whether comparison organisations are direct competitors.
→ Best for: Supply chain, procurement, HR practices, after-sales service
4
🌟
Best-in-Class Benchmarking
A comparison against organisations recognised as best-in-class in a specific capability — regardless of industry — to identify the highest achievable performance standard and the practices behind it.
→ Best for: Customer experience, digital transformation, safety culture, talent management
⸺ WHY context changes everything
The Same Score Means
Different Things in
Different Contexts.
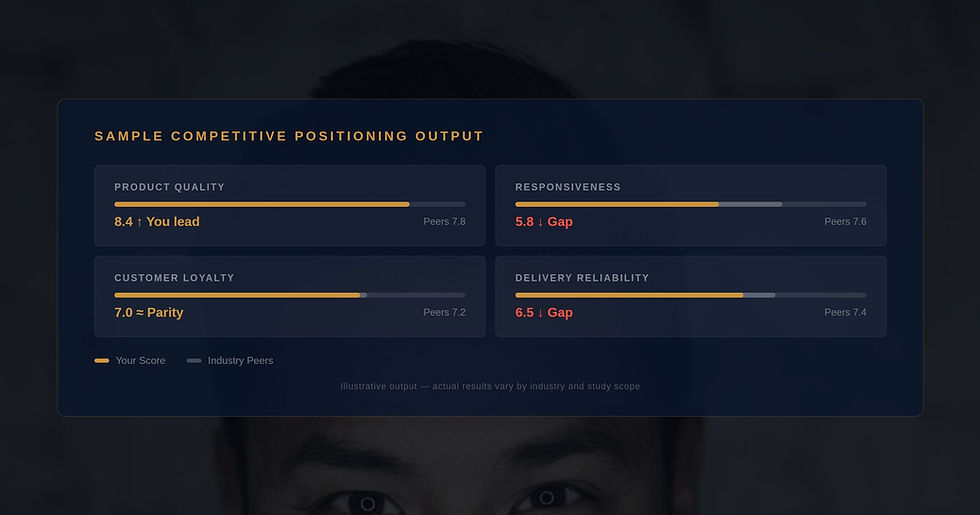
A score without a benchmark is just a number. A score with an industry benchmark is intelligence. BPMBC's benchmarking studies contextualise your performance — revealing whether you are leading, matching, or lagging your peers on every dimension that matters.
We provide not just the gap, but the context behind it — what the top-quartile performers are doing differently, and the specific interventions most likely to close the performance gap in your sector.
🔒
Where you stand today
Your score on each dimension, validated against a representative peer group from your industry.
🏭
The gap to close
The specific performance delta between you and the industry median — and the top quartile.
👥
What the best are doing
Qualitative intelligence on the practices and investments driving top-quartile performance in your sector.

Select a representative peer group — by size, sector, geography, and business model — ensuring benchmarks are meaningful and actionable.
Peer Group Design
01
05
04
03
02
Define dimensions to benchmark, identify the peer universe, and design the measurement framework — aligned to your strategic objectives.
Scope and Frmework
Structured interviews and surveys with customers, employees, or stakeholders across your organisation and the peer group.
Primary Research
Statistical analysis comparing your scores to peer median, top quartile, and bottom quartile — with driver analysis for each dimension.
Gap Analysis
Comprehensive benchmarking report with performance positioning, gap analysis, best-practice intelligence, and a prioritised improvement roadmap.
Strategic Report
⸺ OUR APPROACH
Rigorous, independent, and designed to produce benchmarks your board can present to investors and auditors.
A Structured 5-Step Methodology
⸺ benchmarking DIMENSIONS
What We Benchmark
We benchmark across every dimension that drives competitive performance and stakeholder value.
1
♻️
Customer Satisfaction & Loyalty
How your CSS scores, NPS, and customer loyalty metrics compare to your direct competitors and industry best-in-class.
2
🌡️
Supplier & Partner Relationships
How your suppliers rate you as a customer compared to how they rate your competitors — a critical competitive differentiator.
3
💧
Employee Engagement & Culture
How your eNPS, satisfaction scores, and engagement levels compare to industry peers — with talent retention implications.
4
🔗
Operational Performance
Delivery reliability, quality levels, responsiveness, and process efficiency benchmarked against sector norms and top performers.
5
🏘️
Safety Culture Maturity
Your safety culture maturity score benchmarked against industry peers and best-in-class — positioning your EHS programme in context.
6
📊
How customers perceive your value-for-money proposition relative to competitors — and where price or value gaps exist.
Commercial & Pricing Positioning
7
👥
Sustainability & ESG Practices
How your sustainability and circular economy practices compare to industry peers — increasingly relevant for customer and investor assessments.
8
🏆
After-Sales & Service Quality
Complaint resolution speed, technical support quality, and customer service responsiveness benchmarked across your sector.
9
🗺️
Brand & Reputation Perception
How your organisation is perceived by customers, suppliers, and the market relative to competitors — a leading indicator of future market share.
⸺ WHAT YOU RECEIVE
Research Deliverables
A complete competitive intelligence pack — built to inform strategy, targets, and investment decisions.
📋
Executive Summary Report
Board-ready summary of your competitive position — where you lead, where you lag, and the top three strategic priorities.
♻️
Dimension-wise Benchmark Report
Your score vs peer median vs top-quartile across every benchmarked dimension — with statistical significance testing.
👥
Competitive Positioning Map
Visual mapping of your position relative to peers — identifying your competitive strengths, parity zones, and critical gap areas.
📊
Best Practice Intelligence
Qualitative findings on the practices, investments, and approaches driving top-quartile performance in your sector.
🏆
Target-Setting Framework
Evidence-based recommendations for performance targets — grounded in what is achievable based on peer benchmarks and industry trajectories.
🗺️
Leadership Presentation
Optional debrief session with your leadership team — walking through competitive position, strategic implications, and priority actions.
⸺ WHY CHOOSE BPMBC
17 Years of Cross-Industry
Benchmarking Data &
Sector Intelligence.
We don't just run surveys — we bring accumulated cross-industry perspective that makes benchmarks credible.
🔒
Accumulated Benchmark Database
18+ years of primary research across 35+ industries gives BPMBC an unmatched reference base for contextualising your scores against sector norms.
🏭
Independent & Confidential
Peer organisations share information more freely with an independent researcher. Our neutrality enables richer, more candid benchmarking data than self-reported industry surveys.
👥
Deep B2B & Industrial Expertise
We understand the B2B performance dimensions that matter in industrial sectors — not generic consumer-market frameworks applied to the wrong context.
📐
Statistically Rigorous Methodology
Validated questionnaires, peer-matched sampling, and statistical significance testing — benchmarks your board and investors can rely on.
Automotive & Auto Components
Industrial Manufacturing
Chemicals & Specialty Materials
Engineering & Capital Goods
FMCG & Consumer Goods
Industries We Serve
Defence & Aerospace
Financial Services (B2B)
⸺ SECTOR EXPERIENCE
Logistics & Supply Chain
IT & Technology Services
Retail & Distribution
Energy & Utilities
Pharmaceutical & Healthcare
Government & Public Sector
Infrastructure & Construction
⸺ ENGAGEMENT PROCESS
Frequently Asked
Questions
Everything you need to know about commissioning a Competitive Benchmarking & Positioning Research.
We work with you to define the relevant peer universe — typically organisations of similar size, operating in the same sector and geography, with comparable business models. Peers may be named competitors or anonymised industry participants, depending on your preference and the research design.
For most benchmarking studies, we do not interview competitors directly — we interview the shared stakeholder group (customers, suppliers, employees) who have experience with multiple organisations. This produces authentic, perception-based benchmarks without requiring competitors to disclose proprietary information.
Yes. Many clients commission integrated benchmarking studies covering customer satisfaction, supplier relationships, and operational performance in a single study — providing a comprehensive competitive picture at an efficient cost. We design the questionnaire and sampling approach to cover multiple dimensions without survey fatigue.
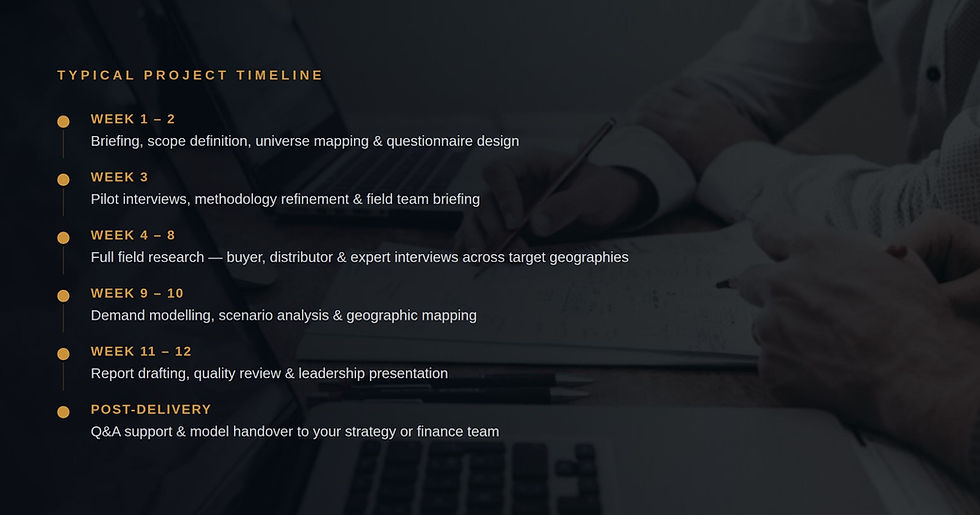
A standard benchmarking study takes 8–12 weeks from briefing to final report, depending on the number of dimensions, the size of the peer group, and the depth of primary research required. Integrated multi-dimension studies may take up to 14 weeks.
Yes — and this is where benchmarking becomes most powerful. Annual tracker studies allow you to measure whether improvement initiatives are closing the gap to peers, monitor competitive dynamics, and demonstrate progress to your board, investors, or customers. 85% of BPMBC benchmarking clients repeat annually.
Yes. Several BPMBC benchmarking studies are specifically commissioned to provide external performance validation for investor decks, board strategy sessions, and ESG reporting. Our documented methodology and statistically rigorous approach meets the standards required for formal external reporting.
"
The BPMBC benchmarking study was the most impactful single piece of research we have commissioned. It told our board precisely where we were leading, where we were average, and — most usefully — where the top performers in our industry were investing to create advantage.
CHIEF STRATEGY OFFICER — DIVERSIFIED INDUSTRIAL GROUP, PUNE